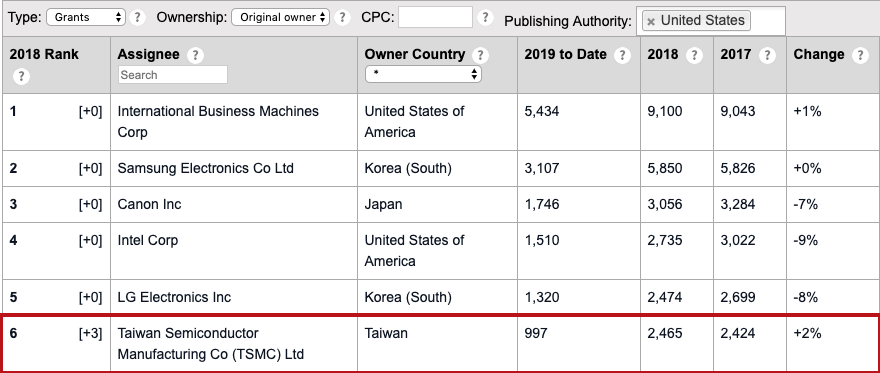
Let’s highlight one particular company that has seen a lot of growth over the past few years, Taiwan Semiconductor Manufacturing Co (TSMC). In 2018, TSMC took the #6 spot in our list of top 50 US patent assignees. They received 2,071 granted patents for the patent classification code H01L (semiconductors) in 2018 out of their 2,465 total.
The screenshot below is the default view of the tool showing counts for all classifications.
With 2019 half over, we were curious to see if TSMC’s semiconductor patent domination trend was holding true. We were a little surprised to see that IBM, not TSMC, is currently leading with 865 US granted patents compared to 804 for TSMC. Patents are not always granted in an orderly pace throughout the year so a lot can still change, but it’s an interesting shift worth taking note of.
The view below was produced on July 2, 2019 by entering the CPC (cooperative patent classification) code for semiconductors, H01L, into the CPC field.
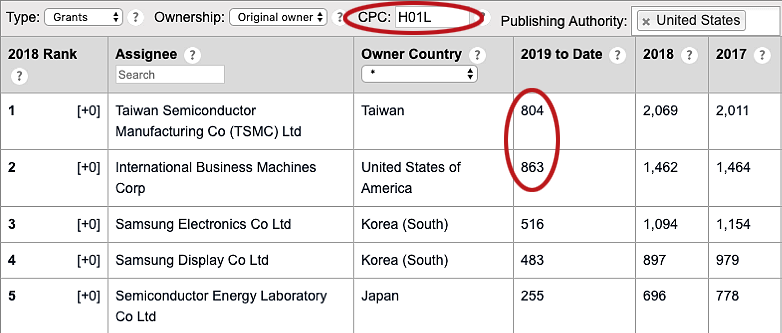
If we were looking at this data using IFI’s ultimate ownership capabilities, which compiles statistics based on corporate entities and their subsidiaries, Samsung Display and Samsung Electronics be ahead of both TSMC and IBM with 999 granted US patents in this time period.
If the current trend continues and IBM winds up with around 1,730 patents in this category for 2019, this will be a 17% increase over their average of 1,463 semiconductor patents for the past two years. IBM may also wind up with another distinction in 2019—receiving more than 10,000 US patent grants. At the mid-year point they have racked up more than 5,288, so it’s a possibility.
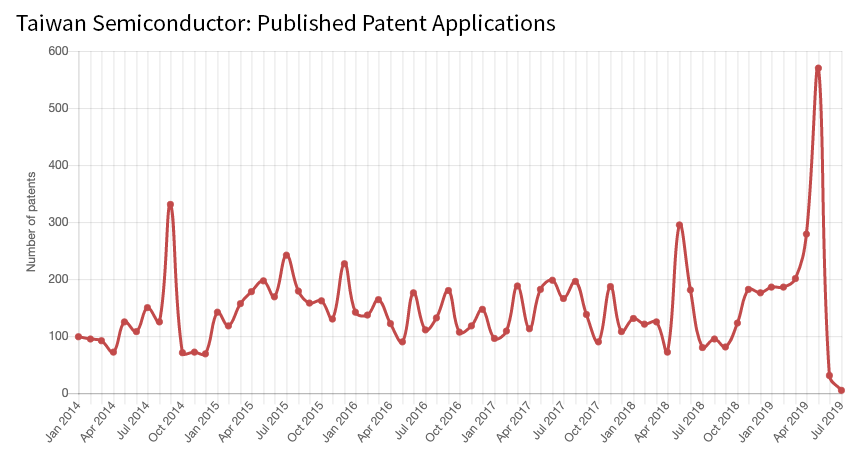
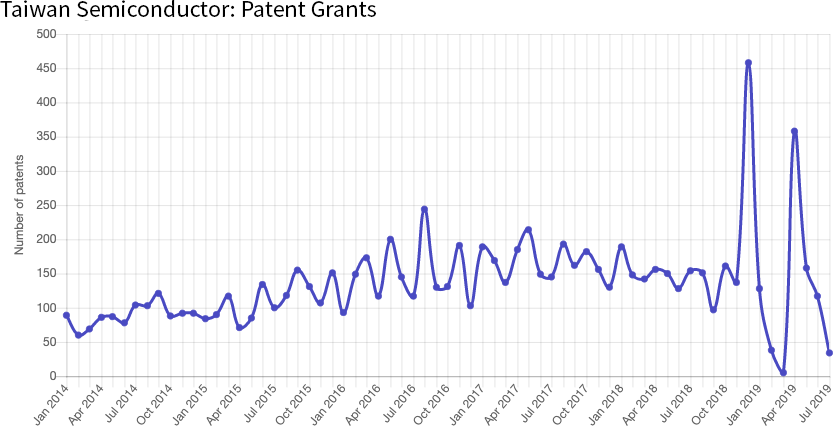
As noted, the problem with using mid-year results to predict year-end totals is pacing. As shown below, patents are published and granted at irregular intervals.
In the chart at the top showing published applications, you can see that many patent applications were recently published. In the patent grant chart, you can see that last year many of their grants were received near the end of the year.
It’s easy to keep tabs on what’s happening in semiconductors or with IBM, Samsung, and TSMC by logging into our Top 1000 interactive tool. Register for a free account and start tracking the trends you’re interested in with live information. While the tool uses data from only the top 1000 US patent recipients from last year, it’s enough information to make exciting discoveries.
