This subject was analyzed in a 2003 paper Time in Pergatory: Determinants of the Grant Lag for US Patent Applications. The paper was written by David Popp, Ted Juhl and Daniel Johnson for the National Bureau of Economic Research. The authors concluded that increasing complexity in new fields like biotechnology was making patent examinations harder. Another very important factor is the number of patent examiners working at the USPTO, and the overall USPTO budget.
But one thing I have noticed over the last decade is the trend towards a greater number of claims being asserted in patents. Claims are what the examiner has to verify and accept, or reject. It seems that if the number of claims submitted by an applicant increases, patent pendency (i.e., the length of the grant lag) should also increase.
The Patently-O patent law blog published a useful graph at “Patent Pendency as a Function of Claim Count”. They show that the grant lag increased with the number of claims during the years 2009-2011.
The USPTO publishes general statistics on patent pendency at their fiscal year statistics site.
At IFI CLAIMS, we used our comprehensive database of global patents to calculate the average number of claims in US granted patents from 1992 – 2011. I have graphed that below, together with the USPTO’s published pendency data.
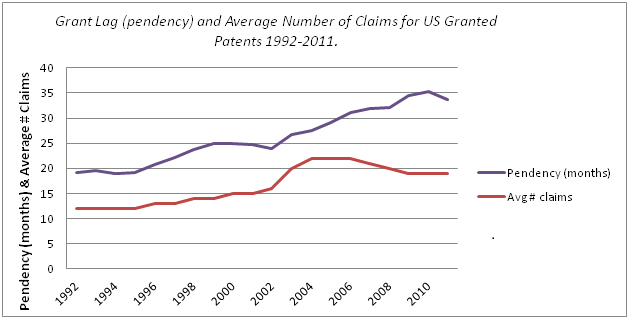
There is a correlation through 2006. In that year, the average number of claims peaked at 22. In the last few years, the average number of claims has declined. Pendency increased until last year when it declined for the first time since 2001.
In terms of the number of claims made in a patent application, the number varies widely. While many patent only contain one claim, some patent contain over 800. That will certainly slow down the examination.
Claims Analysis with KMX
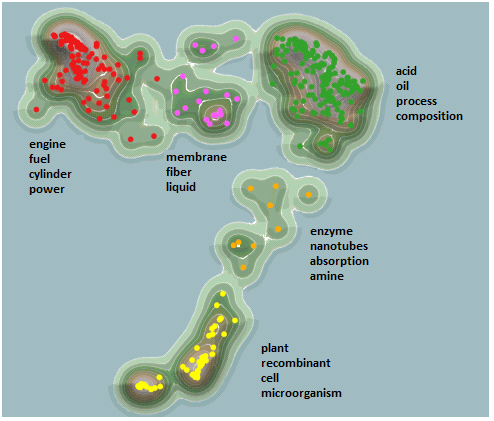
While on the topic of patent claims, I would like to note that the KMX Patent Analytics tool can analyze the actual content of the claims from a large collection of patents. It can answer the question “What topics are covered by the claims?” You certainly can’t answer that question just looking at aggregate statistics. KMX does this by extracting topics, clustering and classifying large numbers of patents. KMX works directly on the text of the claims as provided through the CLAIMS DIRECT web service.Using KMX, I created a data set of 354 patents issued in 2011 containing the term “biofuel”. By analyzing the text contained in the claims, KMX is able to cluster the documents as shown below. I have overlaid a landscape visualization with topics relevant to each cluster. You can see that the patents colored yellow relate to extracting biofuels from plants and genetically modified organisms (like algae). The patents colored red in the upper left relate to using biofuels as fuel. With KMX, I can drill into individual documents and apply additional classifications. The classifications and the associated text can be exported to Excel, to a docket management system or other database.
Reading patents is tedious – especially the claims. Analysts can be much more productive if they let a tool like KMX sort through the documents before they dig into the text themselves.
If you have any questions or comments, please contact us at ificlaims.com.
