How to use patent data for stock selection and build an outperforming investment strategy
Patents rarely make it into the news but as we all know the coronavirus pandemic has brought about a lot of change. One of these changes includes developing a public discourse over the intellectual property (IP) of companies like BioNTech and Moderna. The question of whether infringing upon the legal rights of those companies and their breakthrough mRNA-vaccines will help the cause of fighting the pandemic in poorer countries is not the subject of this piece. However, the matter highlights how important and valuable patents are in a world where all advanced economies are built on innovation and intellectual property. The patent portfolios of BioNTech and Moderna are surely the main reason why their market capitalizations increased by 40 and 28 billion USD respectively over the last 12 months.
On the other hand, the absence of IP can also be valuable information for investors and creditors. In the case of Wirecard the lack of any serious patent activity (1 invention) in the face of patent activity of competitors like PayPal (>900 inventions) should have at least raised eyebrows and triggered analysts to question the technical viability of their business model but aside from anecdotal evidence, does patent data hold valuable information for financial market participants and is there a systematic way to use it?
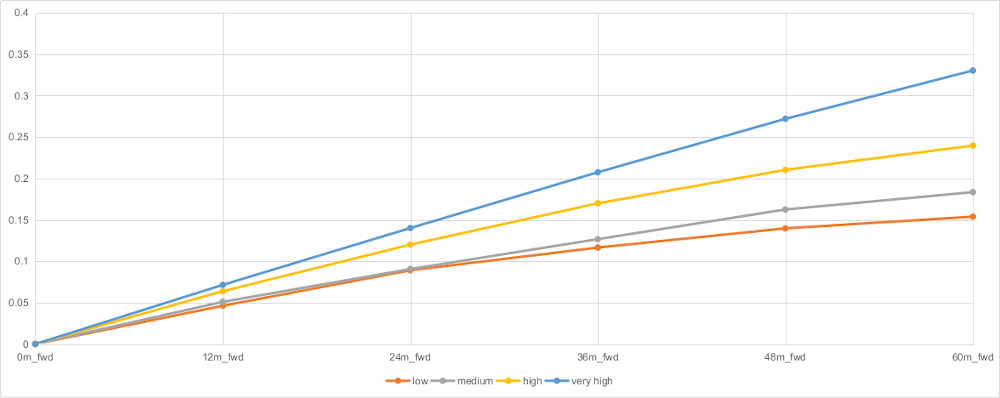
Graph 1 (Patents/Revenue vs Revenue)
To answer that question, we used patent data from our provider IFI CLAIMS. The quality and accuracy of the IFI CLAIMS database makes it possible to conduct thorough research with reliable metrics which is key for anyone building historical data sets for millions of data points.
We ranked a universe of US-listed companies from 1995 based on the number of granted patents over the past 12 months. Every year we divided them into 4 different groups from 1 (highest number of grants/revenue) to 4 (lowest number of grants/revenue). Graph 1 shows that in the subsequent 5 years, these 4 groups showed very distinctive growth paths. The higher the patent activity, the higher the average revenue growth. After five years the growth gap between an average company in groups 1 and 4 amounted to 18 percentage points. This difference cannot be attributed to industry performance. We divided the groups within GICS industries and aggregated later. These numbers don’t reflect higher growth rates for patent-heavy sectors like tech over the last decades, but higher growth rates for patent-heavy companies across all industries.
Patents and Profitability
Revenue growth is one thing, but profitability is something different. Do patent-heavy companies grow market share while disregarding profits? To find out we took the same approach and looked for profit growth patterns along the 4 different groups of patent activity.Graph 2 (Patents/Revenue vs Profits)
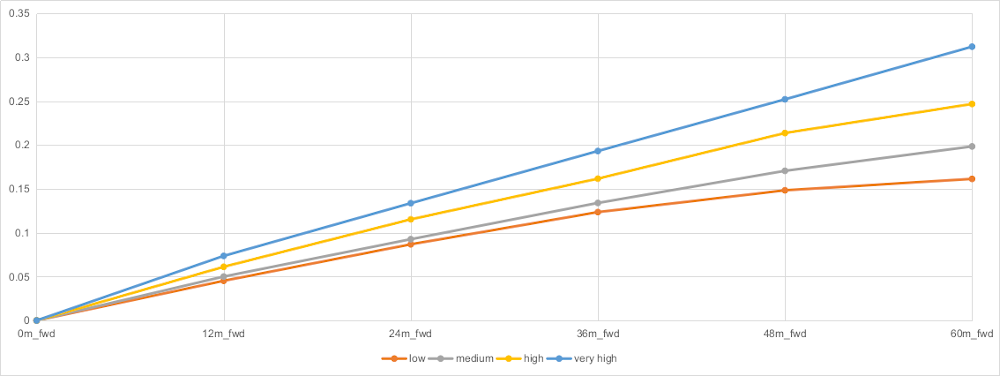
As it turns out patent-heavy companies on average also show higher profit growth than their peers with less patent activity. As with revenue growth the differential after 5 years is significant: 15 percentage points between the average company in groups 1 and 4. In addition, as with revenue growth, the growth differential is very consistent over time.
As we established that patent activity can be used as an early indicator for financial performance, the most important question for investors is: is this information priced by market participants or is it possible to generate higher returns by including patents in the investment process?
Graph 3 (Patents and Stock Market Returns)
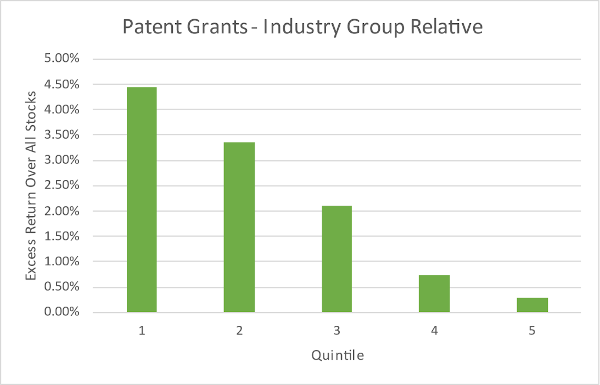
Table 1
| Patent Quintile | Annual Return | Standard Deviation | Downside Dev | Sharpe | Info Ratio | Downside Capture | Upside Capture |
|---|---|---|---|---|---|---|---|
| 1 | 14.6% | 17.3% | 10.8% | 0.68 | 0.71 | 79.1% | 93.5% |
| 2 | 13.5% | 19.7% | 12.4% | 0.54 | 0.86 | 95.7% | 107.6% |
| 3 | 12.3% | 20.6% | 13.1% | 0.46 | 0.51 | 100.9% | 109.0% |
| 4 | 10.9% | 20.8% | 13.5% | 0.39 | 0.19 | 104.4% | 108.1% |
| 5 | 10.5% | 20.8% | 13.6% | 0.37 | 0.09 | 105.9% | 108.2% |
We tried to answer that question in collaboration with O’Shaughnessy Asset Management, a US-based quantitative asset manager. Using a US-stock universe we conducted a test starting in 1990 (full report here). This time we divided stocks according to granted patents into 5 groups and compared the returns for equal weighted portfolios of those quintiles. The results for industry-relative portfolios:
- All portfolios with at least some patent activity outperformed the market (all stocks, market cap weighting)
- The “patent leader portfolio” outperformed by almost 4.5% per annum
- There is a linear relationship between patent activity and outperformance
Table 1 gives you key risk metrics. You can see that the outperformance of patent-heavy companies comes with lower volatility and downside risk. This leaves the risk-adjusted outperformance even higher.
As patent activity highly correlates with company size, we built portfolios normalized by market cap to check for size effects in the return profile. The return spread between top and bottom groups was even higher than with unscaled groups.
Live Track Record
Results like this inspired us to set up a rule-based strategy for stock selection. We aggregated indicators for innovation growth, quality and efficiency using patent data and R&D spending into one signal, the Quant IP Innovation Score. Launching the Quant IP Global Patent Leaders Fund (ISIN: DE000A1J3AN1) in July 2019 we based stock selection only on this score.Graph 4
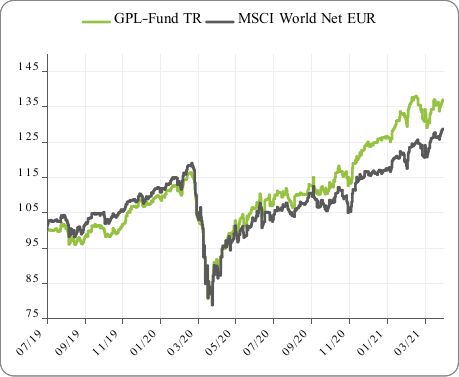
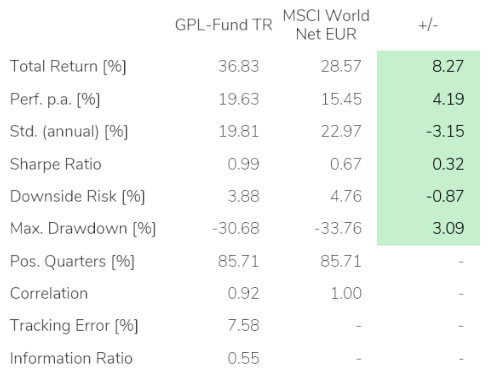
While 24 months is not a very long track record, the results so far are very promising. The fund outperformed its benchmark MSCI World by more than 800 basis points while showing better risk metrics like lower volatility and maximum drawdowns. On a risk-adjusted basis the strategy worked exceptionally well, outperforming during the coronavirus crash of February/March 2020 as well as in the sharp rally following. The performance characteristics closely follow the results of back testing going back to 2004. Here, the Global Patent Leaders Portfolio outperformed the broader stock market by more than 300 basis points per annum with comparable risk metrics.
Conclusion
Back tests show evidence of simple patent metrics like granted patents already working as a good leading indicator for the financial performance of companies independent of size or industry. This relationship does not seem to be perfectly factored in by financial market participants. This is evident when analyzing the results of patent-based stock selection. A portfolio based on simple patent metrics was able to deliver better risk-adjusted returns in back tests going all the way back to 1995. Apart from back tests the Quant IP Global Patent Leaders Fund (ISIN: DE000A1J3AN1) delivers risk-adjusted outperformance with a live track record of 2 years now. That indicates a way for investors to use patent data as a source for true alpha.Author: Lucas von Reuss is Co-Founder and CEO of Quant IP, a Munich-based company focused on patent analytics for investors. Quant IP offers patent metrics, detailed analytics and advice to asset managers, institutional investors, and banks. Quant IP is advisor to the Quant IP Global Patent Leaders Fund, a rule-based global long-only equity fund distributed in Germany.
