Using Patent Data to Evaluate Companies
As shown in the example below, looking at patent trends along with a company’s R&D expenditures over time gives insight into the productivity of research activities. Over the past four years, Pfizer has spent roughly 15 percent of its revenue on R&D, but with a shrinking number of total active patents.
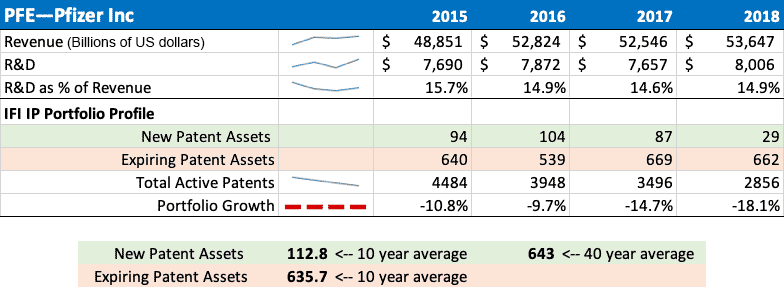
Over a ten-year period, Pfizer has averaged 112 new patent assets per year, but hasn’t reached that amount in any of the last four years. When looking at their 40-year average of 643 per year, this number is even more striking. (Yes, we have data going that far back!) Additionally, an average of 635 patent assets are expiring every year. Their total number of active patents has shrunk to 2,856 from 4,484 over the past four years—a decline of 36%.
Combining these statistics with other data sets and industry knowledge can inform investment managers on possible reasons for this trend. Comparing Pfizer to its competitors would help to determine if this is an industry-wide trend or unique to this company.
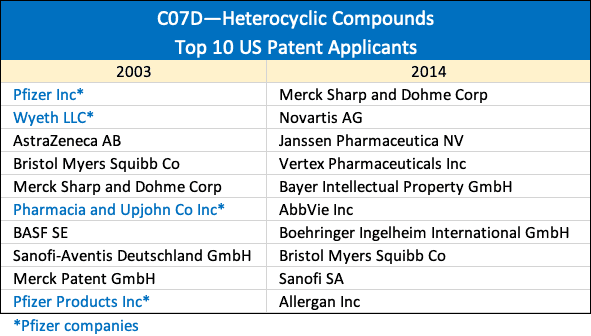
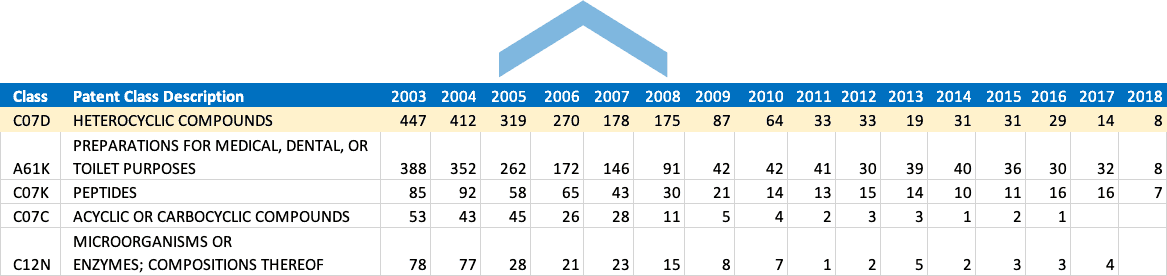
The chart below provides some competitive insights by examining patent classifications. As you can see in the box at the top, Pfizer led the pack in 2003 for Heterocyclic Compounds and for the past 15 years, this has been their top classification. The other companies highlighted in blue on the 2003 column are also owned by Pfizer. In 2014, they no longer appeared on the list of top companies and other large pharma companies have taken their place.
Using Patent Data to Evaluate Industry and Geographic Trends
Monitoring patent classification codes shows which technologies are experiencing rapid growth, as we demonstrate yearly in our Fast Growing Technologies report. It’s not surprising to learn that genomics, medical imaging, and warehouse technology made the list but it does add solid statistics to back up the hype we hear in the news about companies like 23andMe or Amazon.
It’s well known in intellectual property circles that China earns a growing number of US patents every year. Our 2018 Patent Trends and Insights article shows they were the only country to increase its share last year (2018 showed a slight decline in overall patents). Keeping tabs on Chinese inventions, the companies making them, and what technologies they are pursuing is fascinating. If financial data was added to this analysis another window into the story could be opened.
Combining patent information with other types of financial and alternative data leads to exciting new discoveries about companies, new technologies, geographic regions, and industries. Using the most reliable patent data is essential for getting accurate results, and that’s why IFI is the best source. Learn how our unique process ensures the best quality.
