Recently I have been involved in several discussions where questions arose about university patent portfolios. How do these stack up to corporate portfolios, and are universities producing valuable IP? Using PITR we can begin to provide some insight into university patent activity.
Here is a list of the Top 2011 University Patent Assignees ranked by their US granted patents received between 2007-2011. It is no real surprise who shows up as the top performers. University of California, Stanford, and MIT hold the top 3 spots. Almost 200 academic institutions combined were granted 7225 US patents in 2011 which is roughly 11% of what the Top 50 corporates produced.
Former Intel CEO Craig Barrett has a very good article on the important role America's research universities have played in the development of Silicon Valley (UC Berkeley and Stanford) and Boston's Route 128 corridor (MIT). See "To Stay on Top, the US Must Invest in Research Universities" on Forbes.com. Barrett notes that foreign governments are trying to copy this model by co-locating new technology parks near their research universities. Or, in the case of Moscow's Skolkovo Project, an entirely new university is being built. The increase in patent activity in Asian universities is also part of this trend. The US certainly has the lead in university generated IP at the moment. But, that could change.
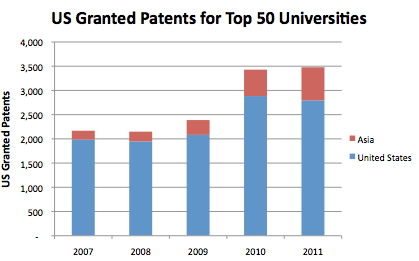
Asian universities show a growing interest in the US patent market. Although still a small subset of the whole, there is a clear growth trend that is likely continue. This chart represents the combined portfolio of the top 50 universities which were all US or Asian with the exception of one Israeli institution. Asian university portfolios grew 277% over the past 5 years compared to 41% growth for the US institutions.
Clearly we would need to dig further to complete a rigorous analysis, but the snapshot is a good start. We could pull these portfolios into KMX Patent Analytics and take a closer look at the technology domains covered by the different institutions.
If you are interested in more information, please contact us at IFI CLAIMS Patent Services.
