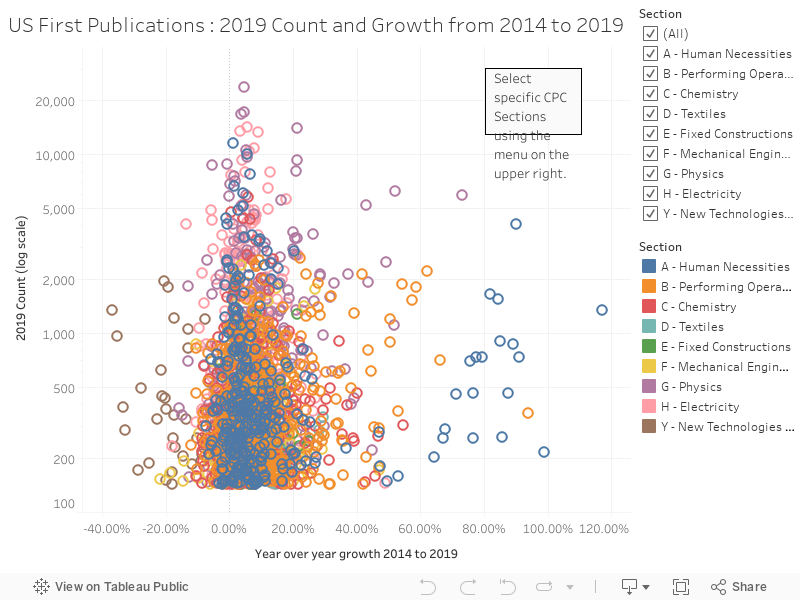
The chart below shows more technologies and their rates of increase or decrease.
Over 4,600 CPC groups were screened by size in 2019 and for rapid growth over the period 2014 to 2019. The largest 2,100 categories were selected, and growth was calculated using the Compound Annual Growth Rate (CAGR) over the six-year period.
Related content
- 2018 Patent Rankings: find out which assignees were granted the most patents in 2018.
- 2018 Patent Trends and Insights: read highlights prepared by our senior analyst.
- Live 1000 Patent Ranking: query and filter our patent database to find live statistics and data visualizations.